
COVID-19: Case counts don't matter. Growth does
The growth of cases is another hot and controversial COVID-19 topic. On one hand, the number of daily is getting to be very large in many European countries. On the other, it doesn't look like this rise in cases is having the same impact as it had before. There is a theory that proposes there might be a lot of dead virus being detected, as well as that the increased amount of testing is the reason behind the increased amount of cases, most of them asymptomatic. As such, we should be ignoring the case numbers and focus on other metrics such as hospitalizations.
In this blog post I hope to convince that case numbers aren't useless. But we should neither be looking at the absolute number of cases nor wait for hospitalizations and deaths to kick in. Instead, we should be looking at the growth rate (or estimates). Through the growth rate, the case counts, no matter how flawed can provide a great early warning system.
The case of Spain
One of the first countries to have a "second wave" of cases was Spain. Lets load up the "our world in data" dataset and compare the two waves to see how they look like.
import pandas as pd
import matplotlib.pyplot as plt
plt.rcParams['figure.dpi'] = 150
plt.rcParams['figure.figsize'] = [6.0, 4.0]
from datetime import datetime
dateparse = lambda x: datetime.strptime(x, '%Y-%m-%d')
owid = pd.read_csv('https://covid.ourworldindata.org/data/owid-covid-data.csv', parse_dates=['date'], date_parser=dateparse)
Spain's first wave started at the beginning of March, while the second wave is still ongoing in August. Lets plot those on the same chart:
esp = owid[owid.iso_code.eq("ESP")]

wave1 = esp.loc[(owid['date'] > '03-01-2020') & (owid['date'] <= '03-29-2020')];
wave2 = esp.loc[(owid['date'] > '08-01-2020') & (owid['date'] <= '08-29-2020')];

wave1 = wave1.reset_index().rename(columns={'new_cases_smoothed': 'Spain March'})['Spain March']
wave2 = wave2.reset_index().rename(columns={'new_cases_smoothed': 'Spain August'})['Spain August']
plot = pd.concat([wave1, wave2], axis=1).plot(grid=True)
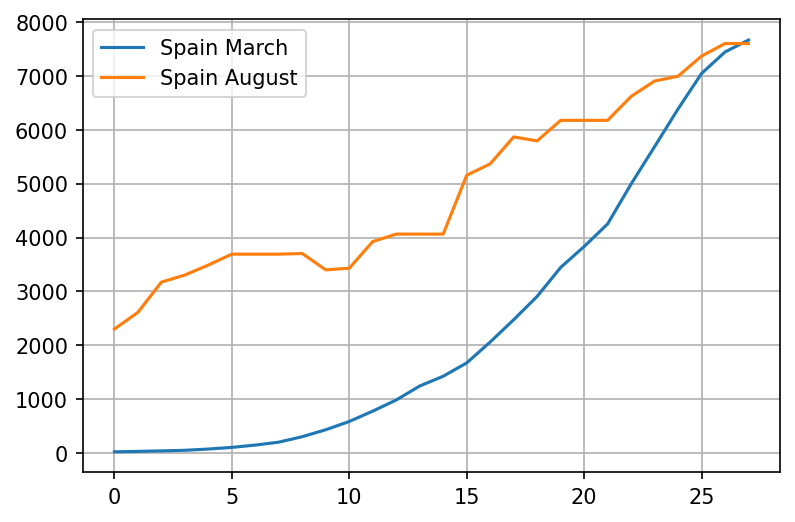
The chart looks very scary, but we can't easily infer the growth rate of the virus by looking at it. Lets try a log plot:
plot = pd.concat([wave1, wave2], axis=1).plot(logy=True, grid=True)
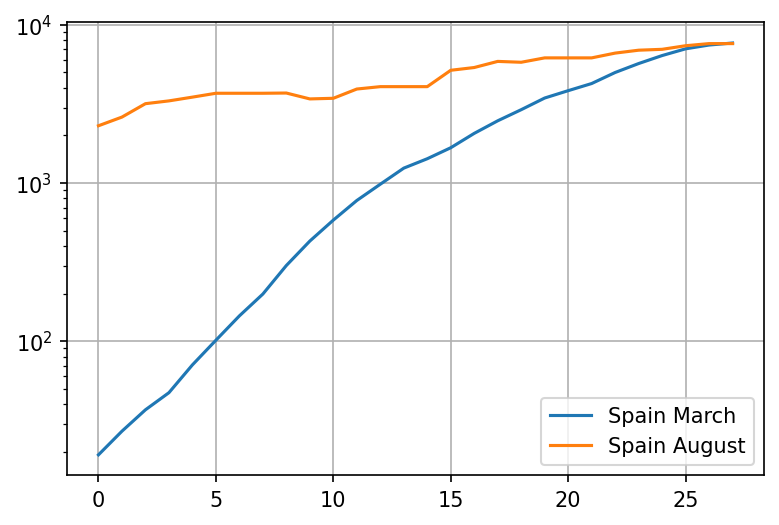
Ok, thats interesting. It appears that despite the case numbers being very high, the growth is significantly slower this time around. Lets try and compare the 5-day rate of growth (which should be pretty close to )
wave1growth = wave1.pct_change(periods=5) + 1
wave2growth = wave2.pct_change(periods=5) + 1
plot = pd.concat([wave1growth, wave2growth], axis=1).plot(grid=True)
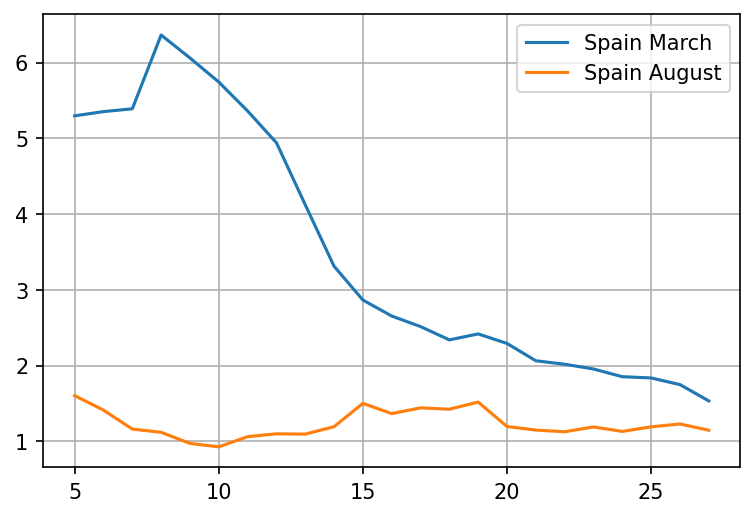
Wow, that is a huge difference. The rate of spread is not even close to the level in March. Lets try zooming in on the period in the middle of the month
wave1growth = wave1.pct_change(periods=5).iloc[15:] + 1
wave2growth = wave2.pct_change(periods=5).iloc[15:] + 1
plot = pd.concat([wave1growth, wave2growth], axis=1).plot(grid=True)
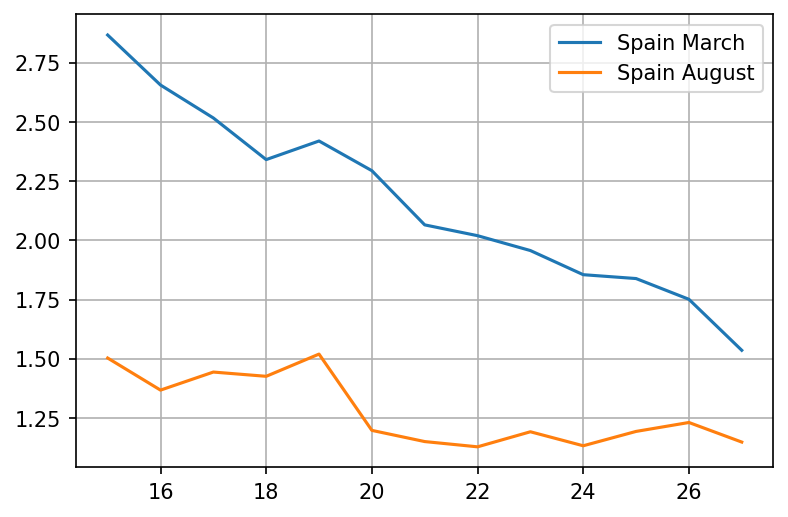
It looks like the growth rate barely went close to 1.5 in August, while in March it was well above 2 for the entire month!
But, why is the growth rate so important? I'll try and explain
The growth rate is the most important metric
There are several reasons why the growth rate is so important
Its resistant to errors or CFR changes
Yes, the rate of growth is largely resilient to errors, as long as the nature of those errors doesn't change much over a short period of time!
Lets assume that 5% of the PCR tests are false positives. Lets say the number of daily tests is , of which 12% is the percentage of true positives today, while 10% is the number of true positives 5 days ago. In this situation, one third of our tests consist of errors - thats a lot!
Without the errors, we would get
Pretty close - and whats more, the increase in errors causes under-estimation, not over-estimation! Note that growth means that the error will matter less and less over time unless tests scale up proportionally.
A similar argument can be made for people who have already had the virus, where the PCR detects virus that is no longer viable. We would expect the number of cases to track the number of tests, so the rate of growth would likely be lower, not higher.
Note: the case with asymptomatics is slightly different. We could be uncovering clusters at their tail end. But once testing is at full capacity, the probability is that we would uncover those earlier rather than later, as the number of active cases would be declining at that point.
It can be adjusted for percentage of positive tests
Lets say that the number of tests is changing too quickly. Is this a problem?
Not really. From the rate of growth, we can compensate for the test growth component, easily.
| x | Cases | Tests |
|---|---|---|
| Today | ||
| 5d ago |
The adjusted rate of growth is
Better picture than absolute numbers
Its best not to look at absolute numbers at all. Hindsight is 20:20, so lets see what the world looked like in Spain from the perspective of March 11th:
esp_march = esp.loc[(owid['date'] > '03-01-2020') & (owid['date'] <= '03-11-2020')];
plot = esp_march.plot(grid=True, x='date', y='new_cases_smoothed')
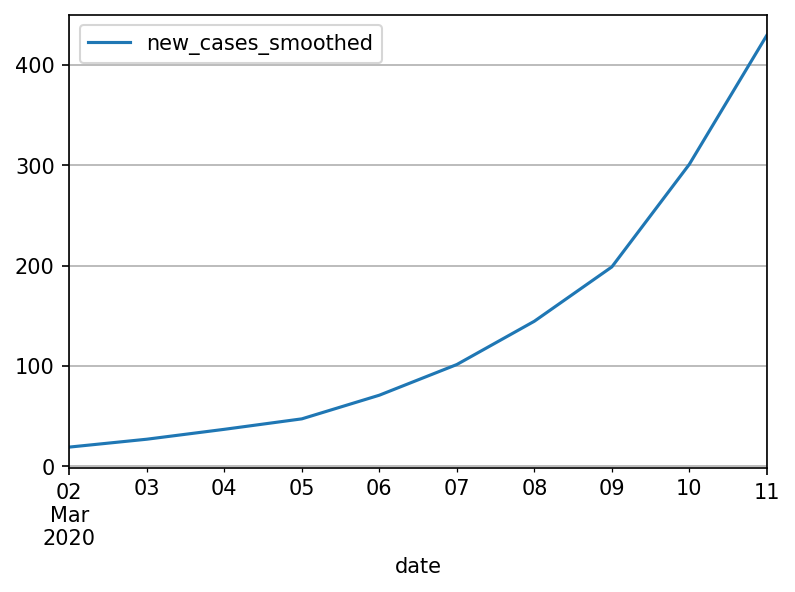
Only 400 cases, nothing to worry about. But if we look at instead
esp_march_growth = esp_march.reset_index()['new_cases_smoothed'].pct_change(periods=5)
plot = esp_march_growth.plot(grid = True)
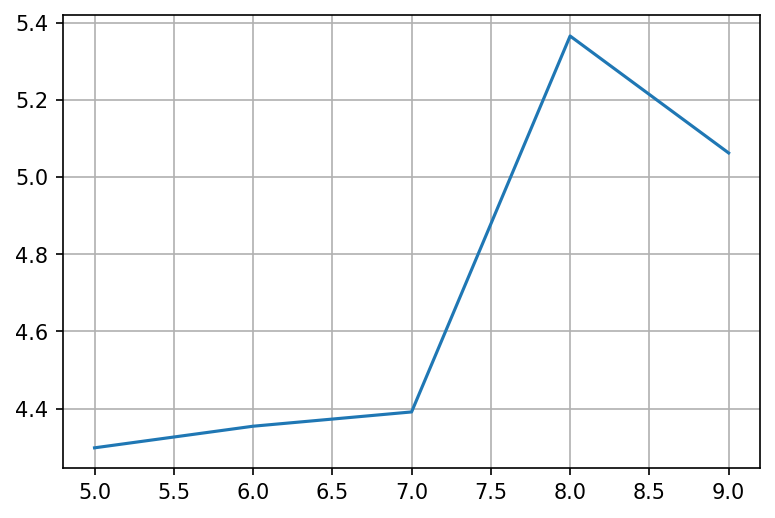
The rate of growth is crazy high! We must do something about it!
It encompasses everything else we do or know
Antibody immunity, T-cell immunity, lockdowns and masks. Their common theme is that they all affect or try to affect the rate of growth:
- If a random half of the population magically became immune tomorrow, the growth rate will probably be halved as well
- If masks block half of the infections, the growth rate would also be halved.
- If 20% of the population stays at home, the number of potential interactions goes down to 64% - a one third reduction in the rate of growth (most likely)
Early growth dominates all other factors
With the following few examples lets demonstrate that getting an accurate estimate of the growth rate and its early control is the most important thing and other factors (absolute number of cases, exact CFR etc) are mostly irrelevant
def generate_growth(pairs):
    result = [1]
    num = 1
    for days, growth in pairs:
        while days > 0:
            num = num * growth
            result.append(num)
            days = days - 1

    return result

big_growth = generate_growth([(14, 1.5), (21, 1.05)])
small_growth = generate_growth([(42, 1.2)])

df = pd.DataFrame(list(zip(big_growth, small_growth)), columns=['big_growth', 'small_growth'])

df.plot()
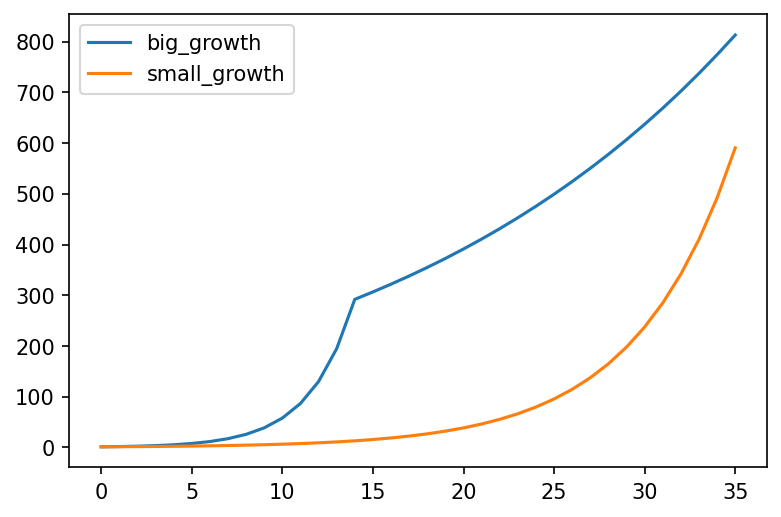
In the above chart, "big growth" represents a country with a big daily growth rate of 50% for only 2 weeks, followed by a much lower growth rate of 5% caused by a stringent set of measures. "small growth" represents a country with a daily growth rate of 20% that never implemented any measures.
This chart makes it clear that growth rate trumps all other factors. If a country's growth rate is small, they can afford not to have any measures for a very long time. If however the growth rate is high, they cannot afford even two weeks of no measures - by that point its already very late.